Current Conditions
♦
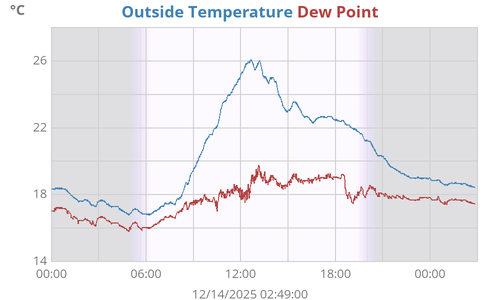
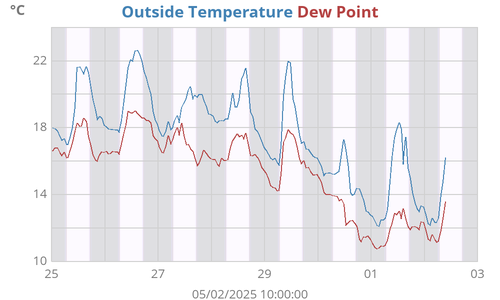
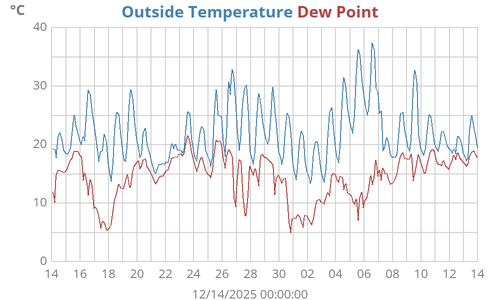
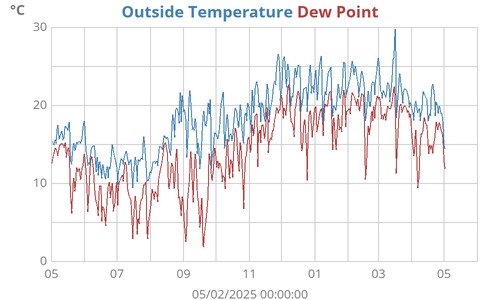
| Outside Temperature | 7.7°C |
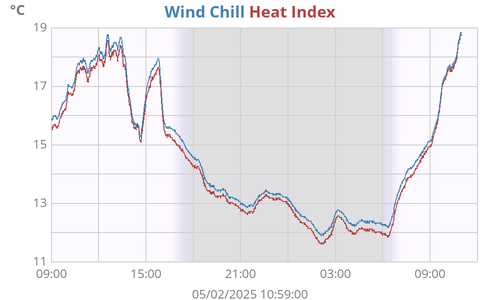
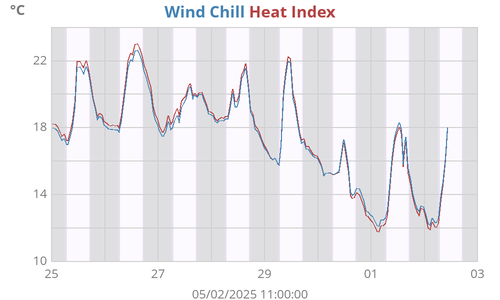
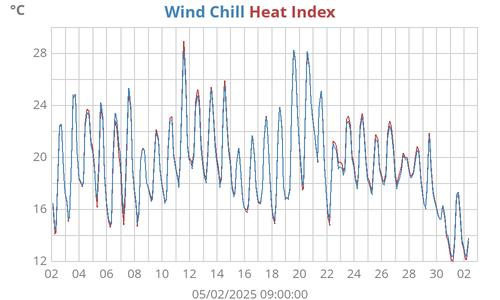
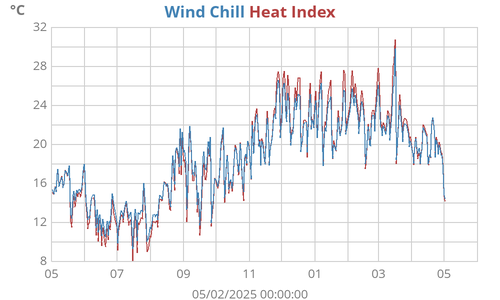
| Heat Index | 6.4°C |
| Wind Chill | 7.7°C |
| Dew Point | 2.9°C |
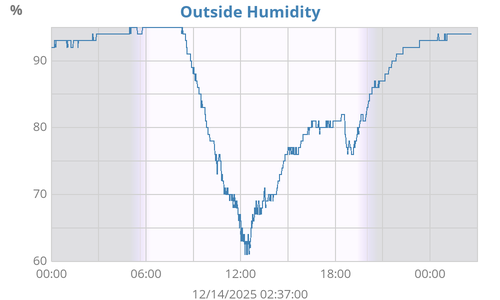
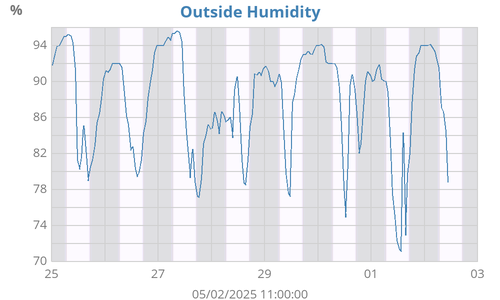
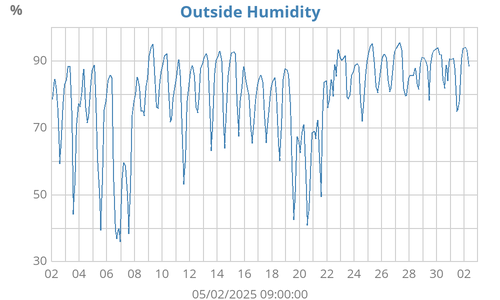
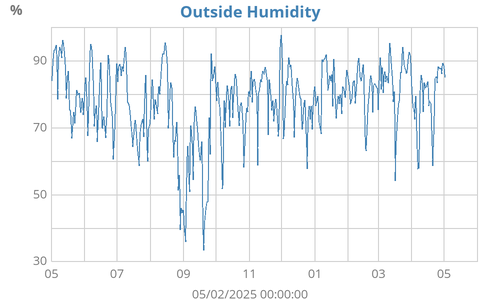
| Outside Humidity | 72% |
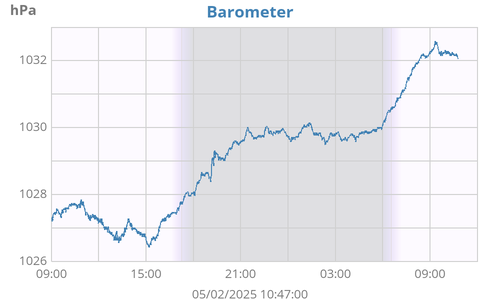
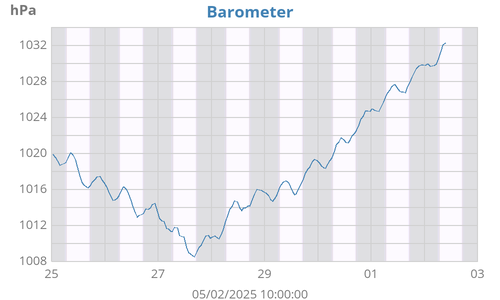
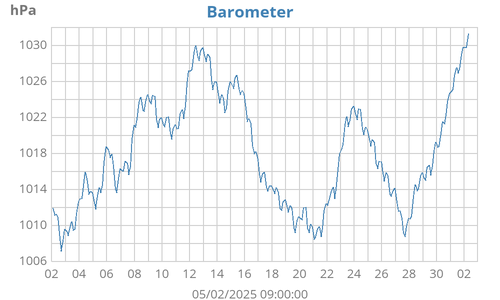
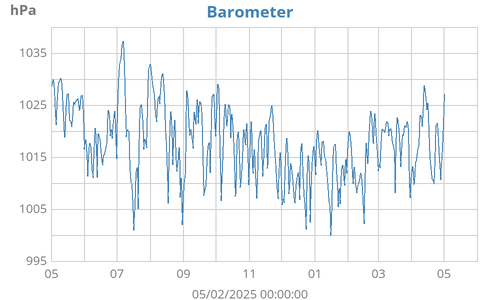
| Barometer | 1011.6 hPa (0.9) |
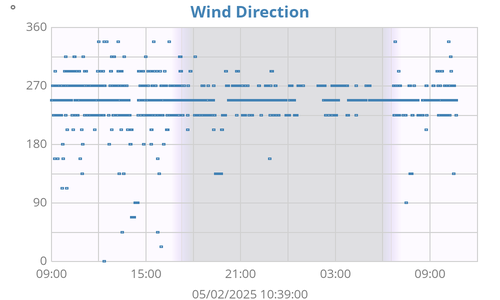
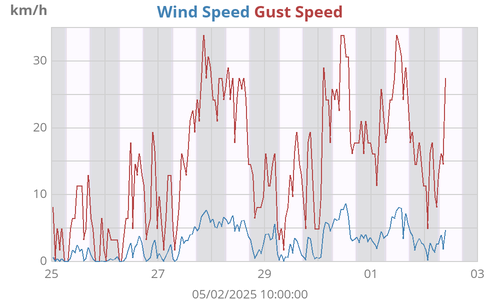
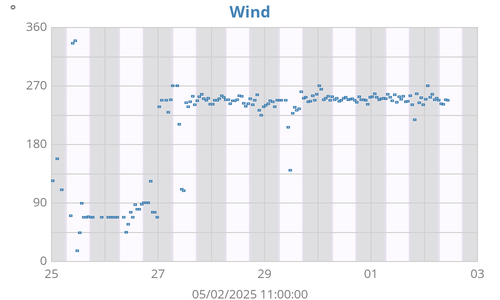
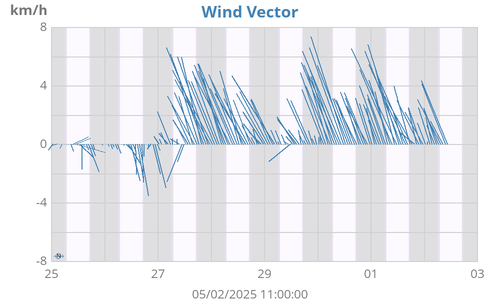
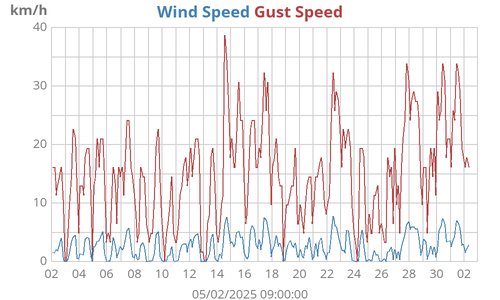
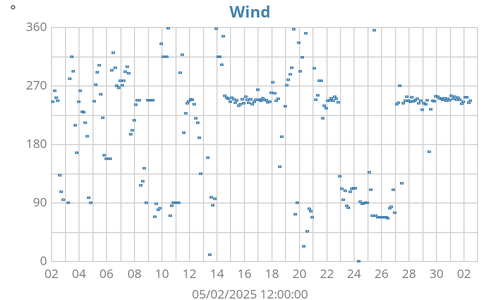
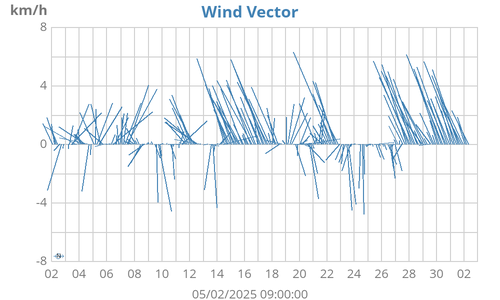
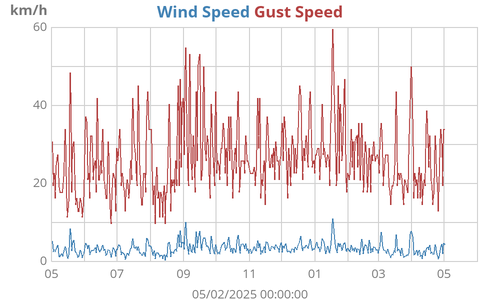
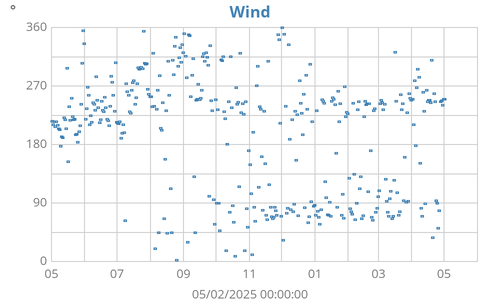
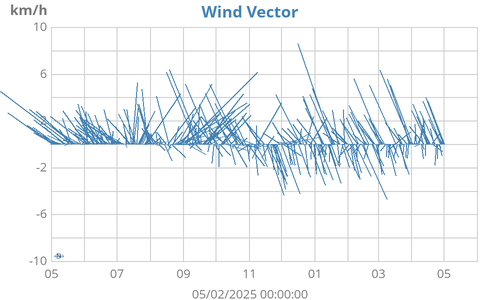
| Wind | 2 km/h NW (315°) |
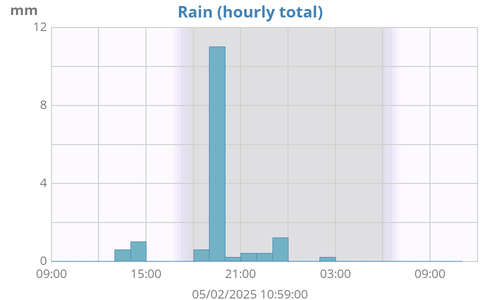
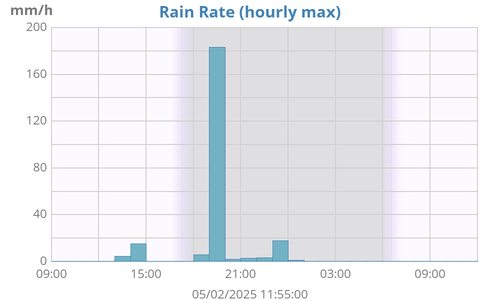
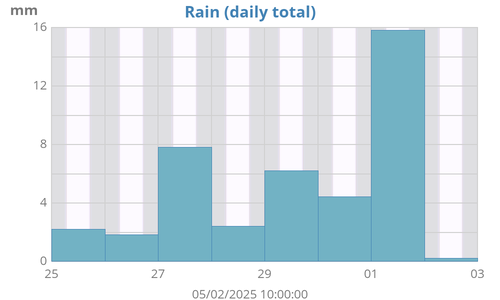
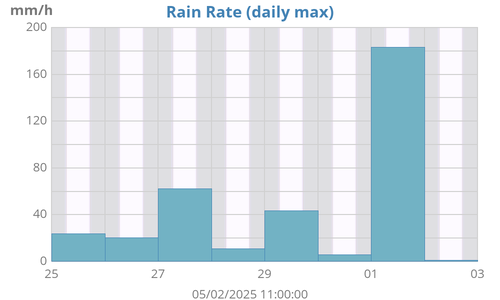
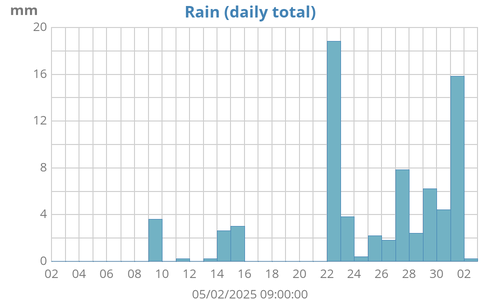
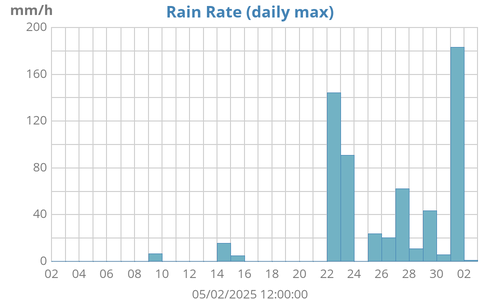
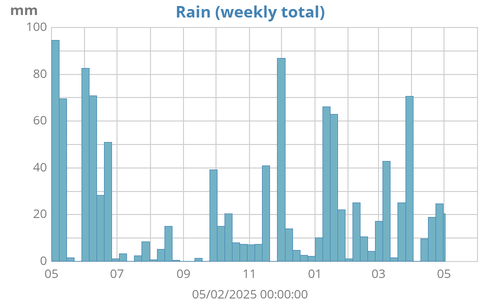
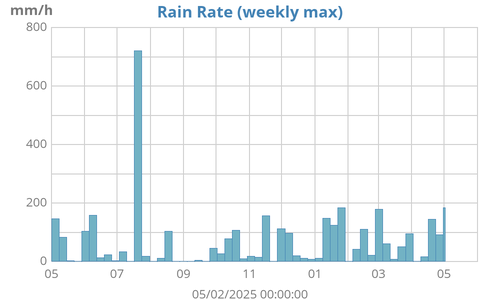
| Rain Rate | 0.0 mm/h |
| Rain Today | 0.0 mm |
| Last Rain | 07/06/2025 19:26:00 8 days, 12 hours, 23 minutes ago |
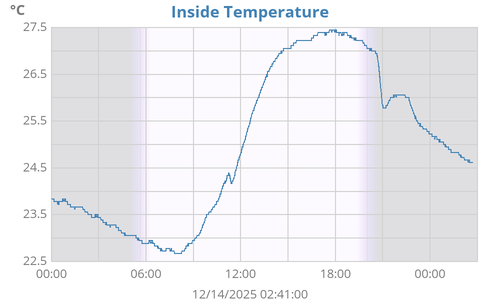
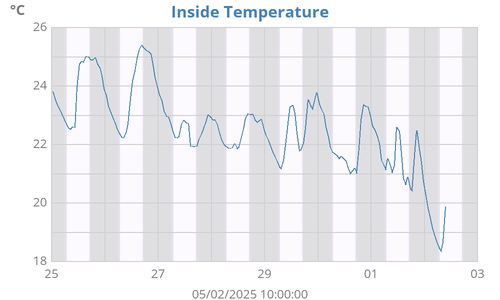
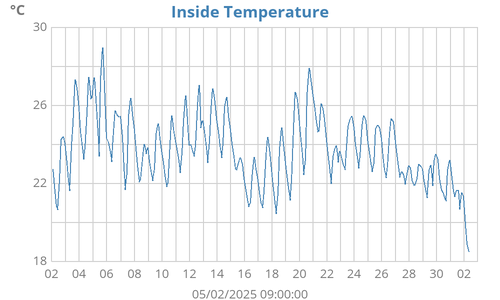
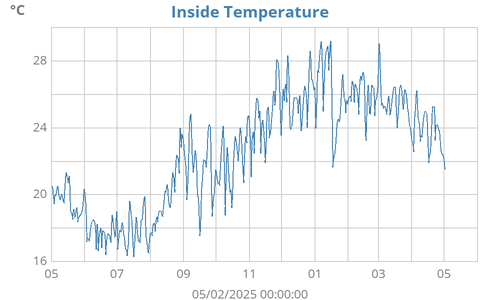
| Inside Temperature | 15.9°C |
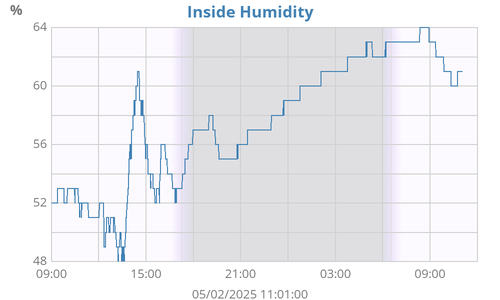
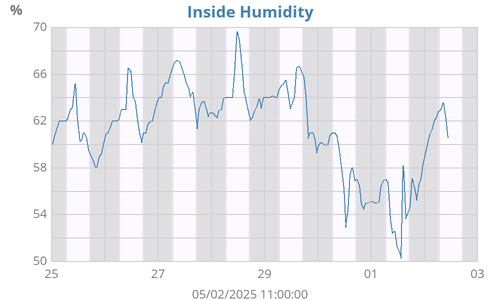
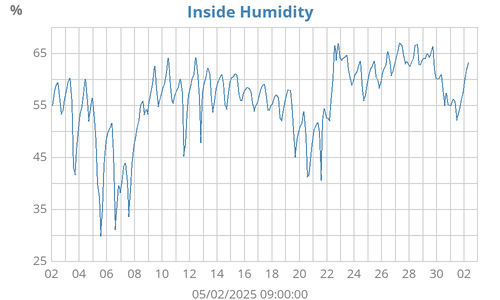
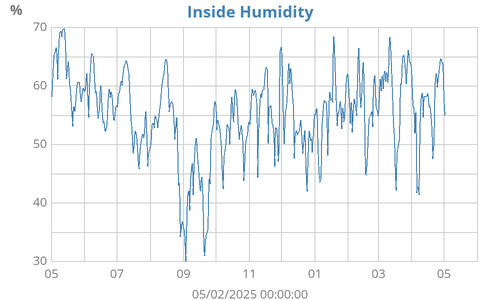
| Inside Humidity | 50% |
| ☀ | ☽ | |||
|---|---|---|---|---|
| Rise | 06:58:57 | Rise | 21:35:50 | |
| Set | 17:05:04 | Set | 09:42:21 | |
| Daylight | 10:06 | Waning gibbous 82% |
| Today |
Week |
Month |
Year |
Rain Year |
All-time |
||
|---|---|---|---|---|---|---|---|
| Outside Temperature |
9.4 7.2 |
18.2 7.2 |
20.6 7.2 |
41.2 5.2 |
41.2 5.2 |
43.2 3.8 |
°C |
| Heat Index |
8.1 5.9 |
17.0 5.9 |
20.5 5.9 |
49.7 3.8 |
49.7 3.8 |
51.3 3.1 |
°C |
| Wind Chill |
9.4 5.2 |
18.2 5.2 |
20.6 5.2 |
41.2 3.9 |
41.2 3.9 |
43.2 2.0 |
°C |
| Dew Point |
3.7 2.3 |
8.6 1.9 |
14.4 1.9 |
25.4 1.5 |
25.4 1.5 |
26.0 -39.5 |
°C |
| Outside Humidity |
72 65 |
82 35 |
97 35 |
98 30 |
98 30 |
99 1 |
% |
| Barometer |
1012.2 1010.4 |
1023.6 1008.0 |
1025.0 993.4 |
1034.5 992.6 |
1034.5 992.6 |
1039.5 984.8 |
hPa |
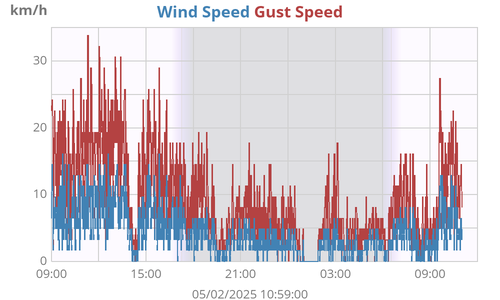
| Max Wind |
16 222 |
24 243 |
58 322 |
60 161 |
60 161 |
69 338 |
km/h ° |
| Average Wind | 3 | 3 | 4 | 3 | 3 | 3 | km/h |
| RMS Wind | 3 | 3 | 5 | 4 | 4 | 4 | km/h |
|
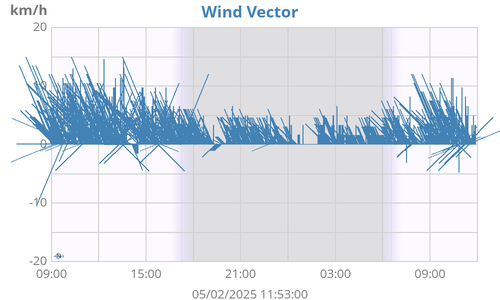
Vector Average Vector Direction |
3 270 |
2 281 |
2 287 |
1 262 |
1 262 |
1 249 |
km/h ° |
| Rain Rate | 0.0 | 0.0 | 34.2 | 182.8 | 182.8 | 1645.8 | mm/h |
| Rain | 0.0 | 0.0 | 88.4 | 709.0 | 709.0 | 11652.4 | mm |
| Inside Temperature |
18.7 15.9 |
21.2 15.9 |
23.1 14.1 |
33.2 14.1 |
33.2 14.1 |
39.6 10.2 |
°C |
| Inside Humidity |
50 47 |
52 43 |
67 43 |
74 28 |
74 28 |
85 13 |
% |
| Connectivity | ||
|---|---|---|
| Signal Quality | 98% | |
| Battery Status | ||
| Transmitter Battery | OK | |
| Voltage | ||
| Console Battery | 4.5 V |
| Hardware | Vantage Pro2 |
| Latitude | 34° 03.58' S |
| Longitude | 151° 01.28' E |
| Altitude | 152 meters |
| Server uptime | 9 days, 15 hours, 20 minutes |
| WeeWX uptime | 1 day, 11 hours, 18 minutes |
| WeeWX version | 5.1.0 |
| Skin | AlltimeSeasons 5.0.0 |
This station uses a Davis Vantage Pro2 (Model 6152,
firmware 3.80 AU) with a WeatherLink 6510 USB Data
Logger, controlled by WeeWX, running in a FreeBSD
jail on TrueNAS Core 13.0, gsutil rsync'd to a Google
Cloud Storage Container on australia-southeast1.
Radar
♦

Weather Cam
♦
Location
♦
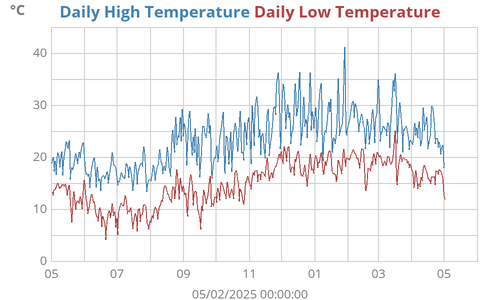
Minimum Temperature
| °C | Jan | Feb | Mar | Apr | May | Jun | Jul | Aug | Sep | Oct | Nov | Dec | Min | |
|---|---|---|---|---|---|---|---|---|---|---|---|---|---|---|
| 2014 | - | - | - | - | 14.7 | 7.1 | 4.7 | 6.1 | 7.3 | 8.8 | 11.4 | 14.6 | 4.7 | |
| 2015 | 12.3 | 16.3 | 12.6 | 10.8 | 6.8 | 5.3 | 3.8 | 3.9 | 6.8 | 11.4 | 12.3 | 13.4 | 3.8 | |
| 2016 | 12.7 | 15.4 | 13.3 | 13.3 | 7.2 | 4.7 | 4.7 | 5.9 | 8.4 | 8.3 | 11.6 | 14.1 | 4.7 | |
| 2017 | 17.2 | 14.8 | 13.7 | 8.2 | 5.8 | 6.1 | 4.3 | 3.8 | 6.2 | 10.3 | 10.5 | 14.3 | 3.8 | |
| 2018 | 12.7 | 14.3 | 11.6 | 10.9 | 7.5 | 4.6 | 5.2 | 5.6 | 6.6 | 9.8 | 10.6 | 13.9 | 4.6 | |
| 2019 | 16.4 | 14.7 | 10.3 | 10.3 | 6.2 | 5.2 | 5.1 | 4.4 | 6.2 | 8.8 | 9.8 | 12.2 | 4.4 | |
| 2020 | 15.3 | 15.3 | 12.7 | 9.6 | 7.7 | 6.8 | 6.9 | 5.4 | 8.9 | 11.3 | 12.2 | 13.7 | 5.4 | |
| 2021 | 15.4 | 16.0 | 13.6 | 9.9 | 7.3 | 4.2 | 5.7 | 7.3 | 7.4 | 9.8 | 10.6 | 13.3 | 4.2 | |
| 2022 | 16.9 | 15.9 | 14.6 | 12.7 | 7.1 | 5.5 | 6.0 | 6.3 | 8.3 | 9.6 | 9.6 | 11.8 | 5.5 | |
| 2023 | 14.2 | 16.1 | 14.7 | 10.8 | 6.2 | 4.8 | 6.3 | 7.2 | 6.3 | 8.9 | 13.1 | 14.5 | 4.8 | |
| 2024 | 16.6 | 15.8 | 13.6 | 11.7 | 7.5 | 4.2 | 5.1 | 7.5 | 6.1 | 11.0 | 13.8 | 14.4 | 4.2 | |
| 2025 | 15.3 | 13.7 | 14.7 | 12.7 | 10.2 | 5.2 | 7.2 | - | - | - | - | - | 5.2 |
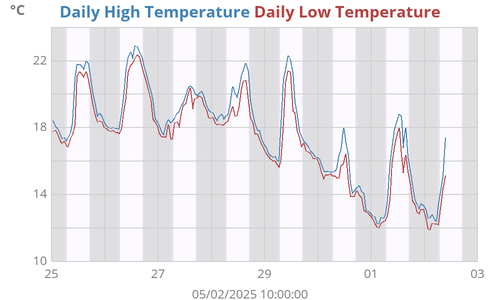
Average Temperature
| °C | Jan | Feb | Mar | Apr | May | Jun | Jul | Aug | Sep | Oct | Nov | Dec | Avg | |
|---|---|---|---|---|---|---|---|---|---|---|---|---|---|---|
| 2014 | - | - | - | - | 14.9 | 13.2 | 12.2 | 12.3 | 15.1 | 18.0 | 19.6 | 20.8 | 15.9 | |
| 2015 | 22.2 | 21.6 | 20.1 | 16.9 | 14.7 | 12.9 | 10.9 | 12.9 | 14.6 | 19.6 | 19.9 | 20.7 | 17.2 | |
| 2016 | 21.5 | 22.6 | 21.4 | 19.1 | 16.3 | 13.1 | 12.6 | 13.0 | 15.3 | 17.2 | 19.9 | 22.3 | 17.8 | |
| 2017 | 23.5 | 23.0 | 20.8 | 17.3 | 15.2 | 13.2 | 12.4 | 12.9 | 16.3 | 18.3 | 18.7 | 22.1 | 17.8 | |
| 2018 | 22.6 | 21.7 | 21.1 | 20.2 | 15.3 | 12.3 | 12.8 | 12.7 | 14.6 | 16.9 | 19.2 | 21.6 | 17.6 | |
| 2019 | 24.0 | 22.0 | 21.0 | 18.8 | 15.9 | 13.1 | 13.0 | 12.9 | 15.4 | 17.9 | 19.8 | 21.1 | 17.9 | |
| 2020 | 22.9 | 22.1 | 20.1 | 18.6 | 14.9 | 13.3 | 13.1 | 13.1 | 16.4 | 18.3 | 20.4 | 20.6 | 17.8 | |
| 2021 | 22.0 | 21.2 | 20.1 | 17.8 | 15.5 | 12.7 | 12.2 | 14.2 | 15.9 | 17.5 | 17.9 | 20.5 | 17.3 | |
| 2022 | 22.7 | 21.6 | 20.4 | 18.4 | 15.8 | 12.3 | 12.4 | 13.6 | 14.9 | 17.3 | 18.0 | 19.4 | 17.2 | |
| 2023 | 21.5 | 22.5 | 22.1 | 17.9 | 14.4 | 13.3 | 13.9 | 14.4 | 17.6 | 18.5 | 19.6 | 22.2 | 18.1 | |
| 2024 | 23.1 | 22.8 | 21.5 | 18.4 | 15.6 | 12.6 | 12.3 | 15.7 | 16.7 | 17.6 | 20.9 | 22.6 | 18.3 | |
| 2025 | 21.9 | 22.6 | 22.0 | 19.5 | 16.3 | 12.4 | 12.9 | - | - | - | - | - | 18.6 |
Maximum Temperature
| °C | Jan | Feb | Mar | Apr | May | Jun | Jul | Aug | Sep | Oct | Nov | Dec | Max | |
|---|---|---|---|---|---|---|---|---|---|---|---|---|---|---|
| 2014 | - | - | - | - | 15.1 | 20.5 | 23.7 | 21.1 | 32.4 | 32.9 | 38.1 | 32.0 | 38.1 | |
| 2015 | 35.6 | 32.6 | 33.8 | 30.7 | 25.5 | 21.2 | 18.9 | 26.6 | 28.3 | 36.9 | 40.2 | 37.8 | 40.2 | |
| 2016 | 39.1 | 39.1 | 31.9 | 33.9 | 26.8 | 21.1 | 24.4 | 24.2 | 23.7 | 31.1 | 34.3 | 37.4 | 39.1 | |
| 2017 | 40.2 | 43.2 | 31.3 | 26.4 | 23.9 | 19.2 | 26.1 | 22.9 | 34.5 | 34.1 | 29.1 | 38.1 | 43.2 | |
| 2018 | 42.9 | 37.4 | 37.9 | 34.8 | 27.2 | 19.8 | 24.2 | 24.7 | 31.3 | 29.8 | 36.2 | 35.7 | 42.9 | |
| 2019 | 39.6 | 35.2 | 34.1 | 31.7 | 25.1 | 21.4 | 22.5 | 23.8 | 27.8 | 34.6 | 35.1 | 41.1 | 41.1 | |
| 2020 | 43.1 | 40.4 | 37.5 | 28.3 | 26.3 | 21.8 | 22.7 | 24.8 | 30.9 | 32.8 | 40.4 | 32.8 | 43.1 | |
| 2021 | 38.1 | 32.4 | 31.8 | 29.7 | 25.2 | 21.5 | 23.8 | 27.0 | 29.2 | 31.0 | 28.4 | 35.7 | 38.1 | |
| 2022 | 30.6 | 35.2 | 28.3 | 27.8 | 25.2 | 19.8 | 20.4 | 23.3 | 23.7 | 27.6 | 27.4 | 31.6 | 35.2 | |
| 2023 | 34.6 | 33.4 | 38.5 | 27.0 | 23.6 | 23.3 | 24.6 | 24.9 | 34.8 | 35.4 | 28.7 | 41.4 | 41.4 | |
| 2024 | 38.8 | 38.9 | 33.9 | 29.4 | 23.2 | 20.8 | 22.1 | 29.3 | 28.8 | 28.8 | 36.2 | 36.3 | 38.9 | |
| 2025 | 41.2 | 34.9 | 36.1 | 29.8 | 25.7 | 21.6 | 20.6 | - | - | - | - | - | 41.2 |
Rainfall (mm)
| mm | Jan | Feb | Mar | Apr | May | Jun | Jul | Aug | Sep | Oct | Nov | Dec | Total | |
|---|---|---|---|---|---|---|---|---|---|---|---|---|---|---|
| 2014 | - | - | - | - | 0.0 | 69.8 | 6.2 | 293.8 | 27.0 | 106.8 | 40.8 | 103.2 | 647.6 | |
| 2015 | 167.8 | 107.8 | 42.6 | 355.0 | 75.0 | 54.4 | 36.8 | 51.8 | 37.6 | 49.8 | 110.8 | 48.2 | 1137.6 | |
| 2016 | 225.2 | 19.4 | 66.4 | 71.2 | 25.0 | 255.4 | 64.4 | 111.4 | 45.6 | 28.4 | 16.8 | 67.2 | 996.4 | |
| 2017 | 59.2 | 109.0 | 284.6 | 84.0 | 22.8 | 107.2 | 10.6 | 17.4 | 1.6 | 41.2 | 40.2 | 63.4 | 841.2 | |
| 2018 | 23.6 | 50.2 | 56.2 | 15.6 | 11.8 | 76.4 | 9.0 | 9.4 | 26.8 | 137.4 | 65.6 | 79.6 | 561.6 | |
| 2019 | 36.8 | 33.8 | 153.4 | 21.6 | 6.4 | 84.8 | 22.8 | 51.4 | 79.6 | 28.4 | 21.6 | 2.0 | 542.6 | |
| 2020 | 99.4 | 323.2 | 98.6 | 59.4 | 54.6 | 43.8 | 146.4 | 63.2 | 28.8 | 99.6 | 36.0 | 65.8 | 1118.8 | |
| 2021 | 70.4 | 75.8 | 252.8 | 11.0 | 102.4 | 41.8 | 29.4 | 59.4 | 25.8 | 55.0 | 134.8 | 68.2 | 926.8 | |
| 2022 | 138.8 | 230.4 | 495.6 | 206.6 | 128.6 | 13.0 | 511.2 | 26.2 | 84.4 | 172.8 | 41.8 | 39.0 | 2088.4 | |
| 2023 | 146.8 | 198.8 | 73.0 | 89.4 | 23.0 | 11.4 | 12.2 | 71.0 | 26.6 | 44.6 | 154.2 | 134.2 | 985.2 | |
| 2024 | 70.8 | 124.8 | 47.8 | 164.4 | 165.8 | 232.0 | 14.6 | 21.2 | 40.2 | 52.2 | 126.4 | 37.0 | 1097.2 | |
| 2025 | 161.8 | 39.6 | 157.0 | 57.4 | 194.4 | 10.4 | 88.4 | - | - | - | - | - | 709.0 |
Days when rain fell
| Days | Jan | Feb | Mar | Apr | May | Jun | Jul | Aug | Sep | Oct | Nov | Dec | Total | |
|---|---|---|---|---|---|---|---|---|---|---|---|---|---|---|
| 2014 | - | - | - | - | 0 | 6 | 2 | 10 | 8 | 3 | 7 | 11 | 47 | |
| 2015 | 10 | 10 | 7 | 15 | 5 | 5 | 4 | 4 | 9 | 6 | 12 | 8 | 95 | |
| 2016 | 12 | 5 | 7 | 7 | 5 | 8 | 8 | 7 | 8 | 3 | 4 | 7 | 81 | |
| 2017 | 9 | 9 | 20 | 7 | 4 | 5 | 2 | 2 | 1 | 5 | 8 | 12 | 84 | |
| 2018 | 3 | 8 | 11 | 3 | 4 | 10 | 1 | 4 | 6 | 12 | 5 | 10 | 77 | |
| 2019 | 5 | 6 | 14 | 4 | 2 | 8 | 3 | 4 | 5 | 4 | 4 | 0 | 59 | |
| 2020 | 8 | 13 | 16 | 9 | 6 | 9 | 8 | 4 | 5 | 10 | 4 | 11 | 103 | |
| 2021 | 9 | 11 | 11 | 2 | 8 | 11 | 8 | 4 | 6 | 8 | 13 | 7 | 98 | |
| 2022 | 11 | 18 | 22 | 15 | 9 | 2 | 14 | 6 | 12 | 12 | 3 | 7 | 131 | |
| 2023 | 13 | 7 | 11 | 11 | 3 | 3 | 3 | 11 | 5 | 6 | 11 | 9 | 93 | |
| 2024 | 9 | 10 | 10 | 6 | 13 | 8 | 4 | 4 | 7 | 8 | 13 | 5 | 97 | |
| 2025 | 12 | 6 | 14 | 11 | 11 | 2 | 3 | - | - | - | - | - | 59 |